Warwick’s inability to adjust its staffing, facilities, and spending in response to long-term declines in student enrollment has resulted in growing inefficiency within the school system. In 2017 By the 2024–2025 school year, many of Warwick’s elementary schools were operating at just 50% to 70% capacity.
Ten years ago, SMMA warned that Warwick had more elementary buildings than needed for its student numbers and advised closing and consolidating some schools to improve efficiency, cut fixed costs, and align the district’s size with enrollment. In 2015 they stated that, “With decreasing enrollment, Warwick’s over-capacity gets worse every year and subtracts from the dollars you have to send on education”.
Instead of following these recommendations, the School Committee allowed building usage to decrease even further. As student numbers dropped but the number of schools stayed the same, fewer students were spread across the open elementary schools. This meant the district continued paying to heat, staff, maintain, insure, and operate underfilled buildings, leading to millions of dollars in unnecessary annual expenses.
A. Under Utilized Elementary Schools
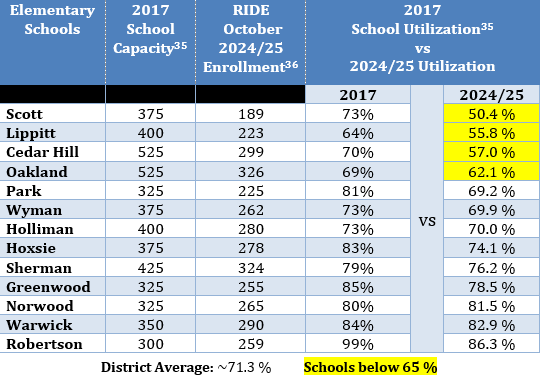
📱 Rotate your phone to landscape to view the complete chart.
The financial effects of having underutilized school building in Warwick have been severe. Warwick’s per-student cost has increased faster than local revenue or state funding because fixed costs are now divided among fewer students. In a well-aligned district, closing schools and adjusting staffing would keep per-pupil costs stable by matching spending to student numbers. However, in Warwick, the opposite happened: staffing levels held steady or rose, buildings remained open, and needs for special education and support services grew—even though enrollment fell. This led to a structural imbalance that not only inflated yearly budgets but also worsened the misalignment by over six times since 2019.
SMMA’s 2015 report made it clear: Warwick could not maintain its current school system without significant and consistent growth in student numbers—a trend that never occurred. Each year the district delayed school consolidation, its overhead became more disproportionate, per-student costs climbed, and financial risks increased. By disregarding SMMA’s advice—alongside later warnings from Barton Gilman and its own former Superintendent Thornton, the district locked itself into an expensive and inefficient model that was unsustainable once temporary federal COVID relief funds (ESSER aid) ran out.
Warwick’s failure to realign produced a “perfect storm” of inefficiency: schools with too few students, soaring per-pupil expenses, high personnel costs, and a structural deficit that local taxpayers could not cover. These problems directly led officials to declare a fiscal emergency and request state legislative intervention, resulting in the creation of a Warwick Public School Budget Commission—a drastic measure taken only when governance and financial imbalance reach a crisis point.
When Warwick schools closed in March 2020 due to the statewide COVID-19 shutdown, the district was presented with an opportunity to implement further elementary school consolidation. With buildings unoccupied, the school department experienced a minimally disruptive period to realign facilities, student assignments, and staffing to address declining enrollment.
Despite having previously closed two elementary schools in 2018, the School Committee has not pursued any additional consolidation plan. This now poses significant challenges to fiscal sustainability and further exacerbates ongoing discrepancies between enrollment levels, staffing allocations, and facility usage.
B. Per Pupil Costs Exceedingly High
According to RIDE, the Warwick School Department's per-pupil expenditure has risen to $24,883 (FY2024), a figure that significantly exceeds both the Rhode Island state average of $21,600 and the spending levels of comparable "sister" districts. This disparity highlights a structural cost imbalance that cannot be explained solely by student demographics or educational needs.
i. Comparison to Sister Districts
| Warwick Elementary Schools | Per Pupil Cost |
|---|---|
| Park | $27,586 |
| Lippitt | $27,072 |
| Oakland Beach | $24,185 |
| Norwood | $23,212 |
| Holliman | $22,633 |
| Cedar Hill | $21,995 |
| Scott | $20,890 |
| Hoxsie | $20,787 |
| Warwick Neck | $18,887 |
| Sherman | $18,100 |
| Wyman | $17,106 |
| Robertson | $16,577 |
| Greenwood | $16,083 |
Warwick Elementary Schools Per Pupil Cost
When compared to similar communities, Warwick's spending is disproportionately high:
| District | Per Pupil Cost | Warwick Difference | Warwick Spends More |
|---|---|---|---|
| Warwick | $24,883 | — | — |
| East Providence | $21,651 | $3,232 | 15% |
| Cranston | $19,950 | $4,933 | 25% |
📱 Rotate your phone to landscape or swipe horizontally to view the complete table.
Warwick per-pupil spending compared with East Providence and Cranston
This gap is particularly notable given that Warwick has a lower percentage of students requiring high-cost interventions—such as multilingual learners and those qualifying for free or reduced lunch—than both Cranston and East Providence. This suggests that Warwick's premium is not driving additional services for high-need populations but is instead funding operational inefficiencies.
ii. Key Cost Drivers of Disparity
An analysis by the Rhode Island Department of Education (RIDE) identified several specific areas where Warwick's spending diverges sharply from its peers:
Instructional Costs: Warwick spends $12,757 per pupil on instruction, compared to $10,640 in Cranston and $11,680 in East Providence. This is driven largely by smaller class sizes and a higher density of instructional staff compared to enrollment.
Personnel Benefits: Health and medical benefit costs in Warwick are $2,576 per pupil, significantly higher than the ~$2,100–2,200 seen in peer districts.
Out-of-District Tuition: Warwick pays substantially more for students attending Career and Technical Education (CTE) programs outside the district, $2.7 million total, compared to just $772,000 for Cranston and $231,000 for East Providence—despite Warwick hosting its own comprehensive CTE center.
Special Education Placements: The cost for outplaced special education students averages $103,765 per pupil in Warwick, far exceeding the ~$65,000–70,000 range in comparable districts.
C. Conclusion
Warwick's per-pupil cost, now $3,283 above the state average, reflects a district that has not adjusted its operational footprint to match its declining enrollment. While peer districts like Cranston and East Providence educate similar or higher-need populations for significantly less, Warwick's retention of excess staffing, underutilized facilities, and high fixed costs has created a premium that provides no clear educational advantage to its students.