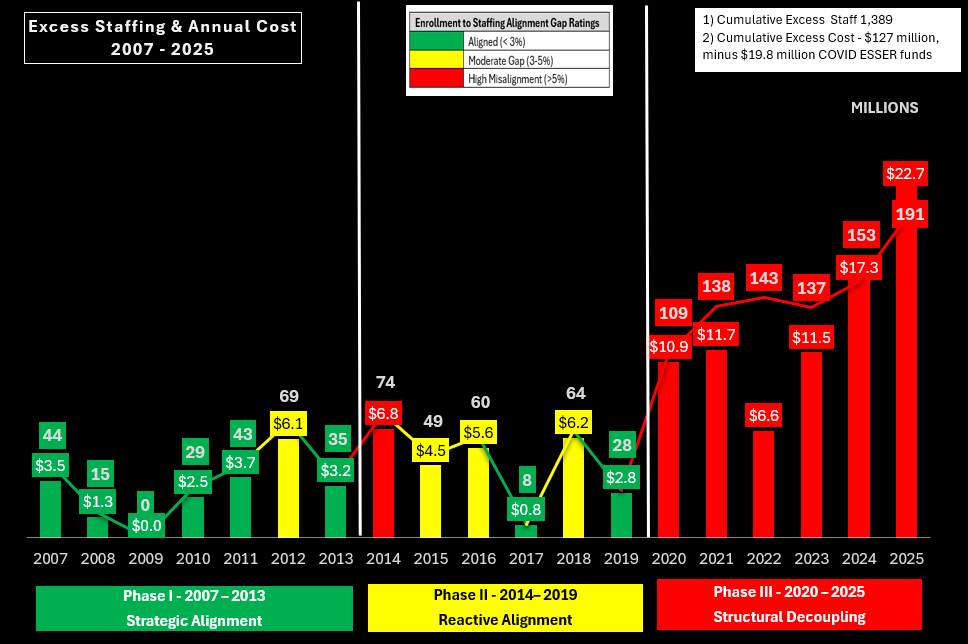
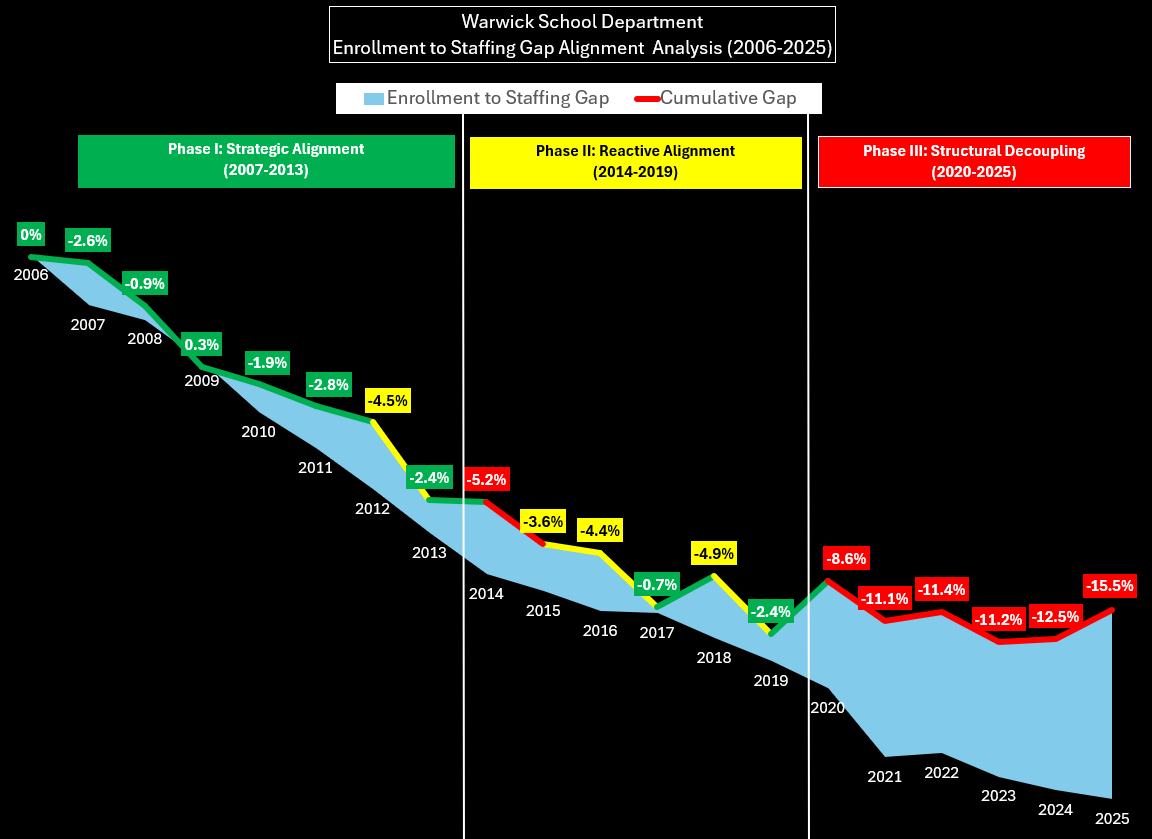
A. Alignment Trajectory
| Phase | Alignment Level | Trend |
|---|---|---|
| Phase I 2007–2013 | Mostly aligned (0–3%) | Stable, improving |
| Phase II 2014–2019 | Moderate misalignment (2–5%) | Volatile, worsening |
| Phase III 2020–2025 | High misalignment (8–16%) | Explosive, collapsing |
B. Additional Revenue
| Phase | Revenue | Average per Year | Comment |
|---|---|---|---|
| Phase I 2007–2013 | $11.3 million – Local | $1.9 million | Reasonable with massive decline in enrollment. |
| Phase II 2014–2019 | $11.5 million – Local | $1.6 million | Contrary to critics, it mirrored Phase I funding. |
| Phase III 2020–2025 | $24.4 million – Local $19.1 million – ESSER1 Total – $43.5 million | $7.3 million | Historic, unsustainable amid a continued enrollment decline. |
1 ESSER represents one-time federal relief funding.
C. School Committee/Superintendent Policy Decisions
| Phase | Leadership Style | Effect on Alignment |
|---|---|---|
| Phase I 2007–2013 | Unified, strategic | Achieved |
| Phase II 2014–2019 | Fragmented, political | Drifted |
| Phase III 2020–2025 | Chaotic, reactive, exclusionary | Collapsed |
D. Executive Summary of Each Phase
| Phase | Executive Summary of Each Phase |
|---|---|
| Phase I 2007–2013 | Phase One worked because consolidation, staffing reductions, and governance discipline kept excess staffing small and cost under control. |
| Phase II 2014–2019 | Phase Two faltered because consolidation stalled, staff reductions became inconsistent, and political conflict replaced strategic planning. |
| Phase III 2020–2025 | Phase Three collapsed because staffing grew while enrollment declined, ESSER temporarily hid the problem, and district leadership abandoned all structural planning—leading to catastrophic misalignment, tens of millions in excess cost, and eventual state takeover. |
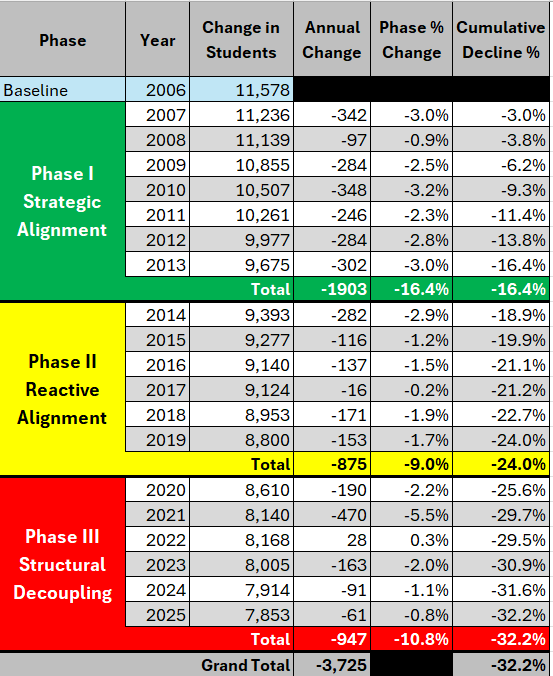
E. (2007–2025) Enrollment Reductions
| Enrollment Reduction by Phase | Students | Cumulative Decline % |
|---|---|---|
| Phase I 2007–2013 | −1,903 | −16.4% |
| Phase II 2014–2019 | −875 | −24.0% |
| Phase III 2020–2025 | −947 | −32.2% |
| Total | −3,725 | −32.2% |
Figure 10 – (2007–2025) Change in Enrollment
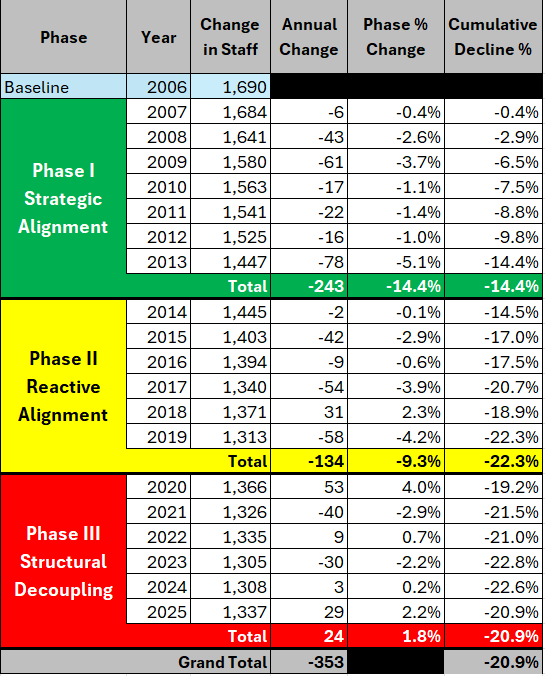
F. (2007–2025) Staffing Reductions
| Staffing Reduction | Staff | Cumulative Decline % |
|---|---|---|
| Phase I 2007–2013 | −243 | −14.4% |
| Phase II 2014–2019 | −164 | −24.1% |
| Phase III 2020–2025 | +24 | −22.7% |
| Total | −383 | −22.7% |
Figure 11 – (2007–2025) Change in Staffing
G. (2007–2025) Excess Staff & Cost
| Excess Staff & Cost | Excess Staff | Cost Impact | Sustainability |
|---|---|---|---|
| Phase I 2007–2013 | 235 | $20.3 million | Controlled, manageable |
| Phase II 2014–2019 | 283 | $26.6 million | Growing, inconsistent |
| Phase III 2020–2025 | 871 | $80.7 million | Critical intervention needed |
| Total | 1,389 | $127.6 million | — |
Figure 12 – (2007–2025) Excess Staff & Cost Analysis
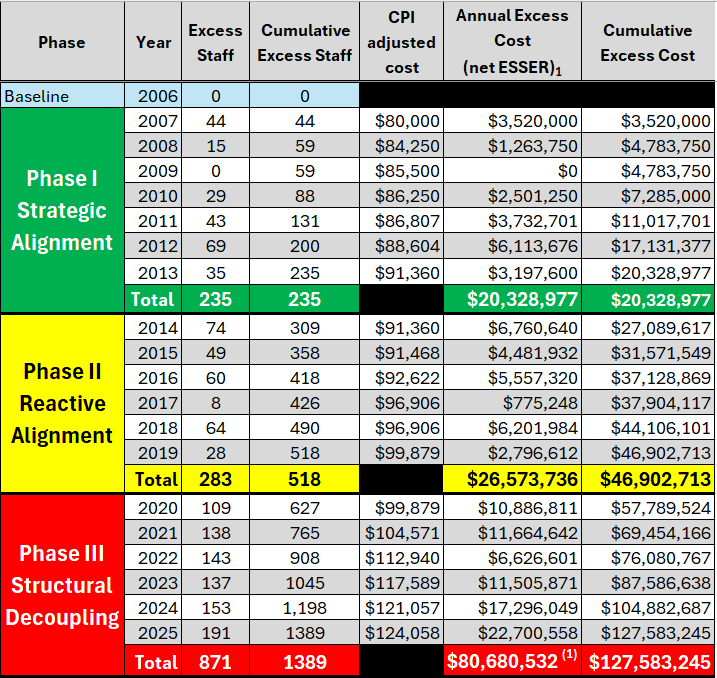
Refer to the methodology section for details on how excess staffing is calculated.
H. (2006–2025) Enrollment & Staffing Cumulative Gap
I. (2006–2025) Excess Staff & Cost