For more than two decades, critics including the Warwick Teacher Union leadership has claimed the school budget challenge as a conflict between “inadequate funding” and the city’s “refusal to invest.” This claim is false; it obscures the true cause of the district’s financial instability. When Warwick’s budgetary history is examined through enrollment data, the alignment gap between the school and city budgets and the changing burden of municipal legacy obligations, a different and more accurate picture emerges.
Warwick’s long-term decline in the school allocation was not the result of city underfunding. It was the result of structural misalignment: a school system that continued operating at the scale of a much larger district while enrollment collapsed by nearly 33%.
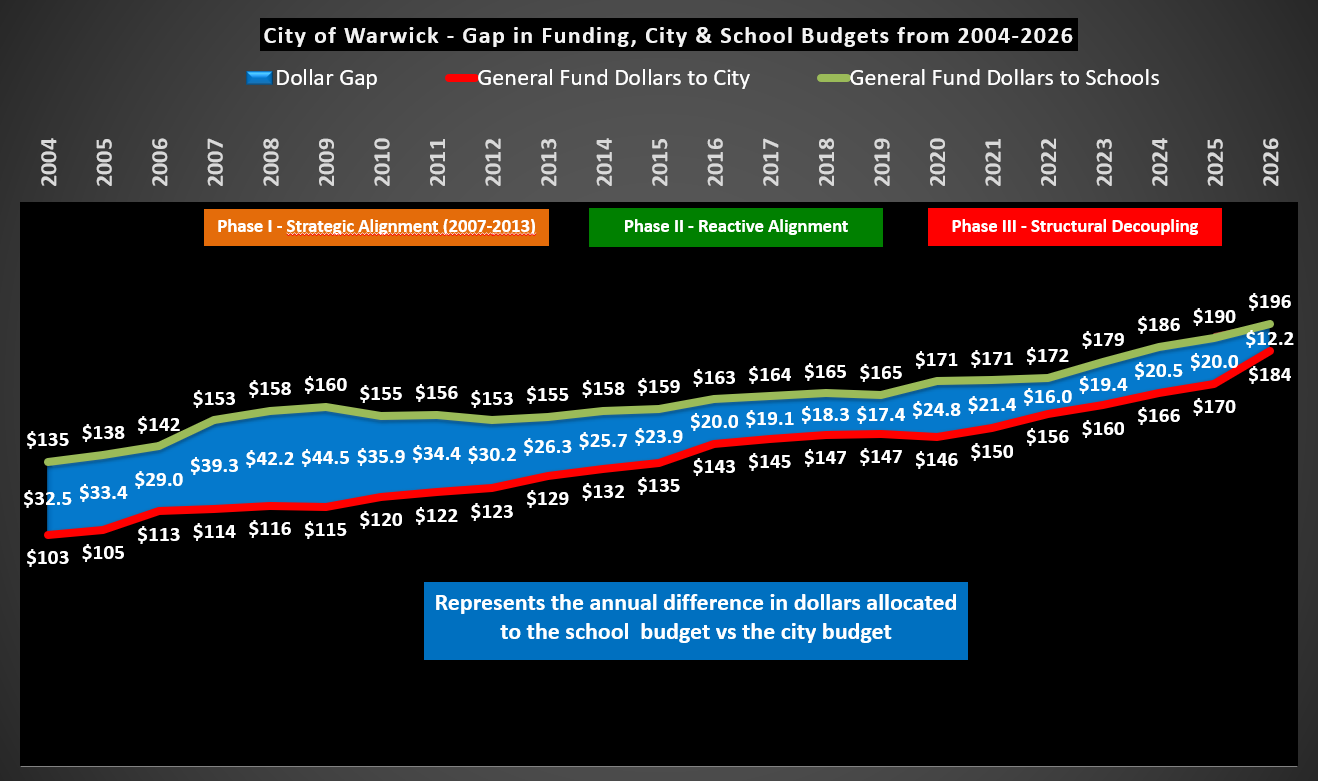
The shrinking gap between the school and city budgets (see the chart below) was not a sign of fiscally responsible budgeting, it was the clearest warning of simultaneous misalignment in both the school and city budgets.
A. Warwick’s Changing Population and the Shrinking Student Base
Beginning in the early 2000s, Warwick entered a period of sustained demographic change. As these forces compounded, the school-age population shrank rapidly:
- Between 2007 and 2025, Warwick lost 3,725 students, a decline of 32.2%.
- Multiple grade levels now operate at half the size they did at the turn of the century.
- Enrollment decline was not temporary, it was structural, persistent, and predictable.
Under normal fiscal governance, school staffing, building inventory, and operating costs would be scaled for enrollment changes. Warwick did this successfully in the Phase I – Strategic Alignment (2007-2013) period, when school closures and staffing adjustments tracked student decline. After 2013, that link weakened.
B. School Allocation Did Not Decline—Enrollment Did
The argument that the city “cut school funding” is not supported by the historical record:
The “decline” exists only when school budgets are measured as a share of the total city general fund budget. This measurement is misleading. Why? Because the city’s total budget grew much faster than the school budget— primarily due to exploding legacy obligations—while school enrollment dropped by one-third.
Thus, what appears to be a “cut” in the school budget is flat-to-modest increases. This distinction is critical.
i. Flat funding + collapsing enrollment does not equal underfunding
Level to small incremental increases in the school budget with significant declining student enrollment equals increased spending per student and increased staffing per student, which Warwick in fact experienced. According to RIDE, the Warwick School Department's per-pupil expenditure has risen to $24,883 (FY2024), a figure that significantly exceeds both the Rhode Island state average of $21,600. Warwick has the one of the highest per pupil cost in the state.
The real deficit driver was not the level of city appropriation; it was the failure to resize the system.
ii. Staff levels did not decline proportionally
Despite losing nearly a third of its students, Warwick has reduced far fewer staff positions than enrollment warranted. Attrition was used instead of strategic realignment.
Contractual provisions hindered workforce flexibility. Federal ESSER money temporarily funded new positions that needed to be eliminated when those funds expired. Those positions were not eliminated.
By 2025, the Gap Analysis shows enrollment down ~32.2% since baseline and employment down only ~20.9%. This resulted in a cumulative misalignment, representing hundreds of excess full-time employees.
iii. Too many schools for too few students
The SMMA Master Plan (2015) explicitly recommended reducing Warwick’s elementary schools from 16 to 10–12, consolidating the system to align with enrollment and modernizing or replacing only viable facilities.
Yet over the next seven years from 2019 to 2025 no consolidations occurred. Several buildings identified by SMMA as high-cost or low-utilization received capital upgrades in the tens of millions of dollars. Ongoing consolidation studies should have determined if the school should have been closed or to spend millions on capital improvements and then redistrict students back into those refurbished schools to bring utilization to reasonable levels.
iv. A structurally oversized footprint costs millions per year
Operating a multi-school elementary system at 60–70% utilization created excess staffing, higher utilities, larger custodial and maintenance loads, inefficient transportation patterns, and a budgetary floor that cannot decline even if enrollment does.
The Warwick School Department internal inefficiency—not city appropriations is the source of the school’s recurring deficits.
C. School Appropriations Flattened while City Budget Consumed by Legacy Costs
While the school budget allocation was flat from 2008 to 2015, the city was simultaneously experiencing its own structural crisis.
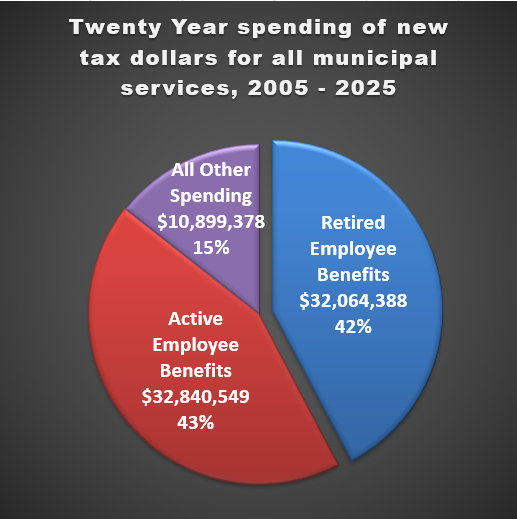
New city revenue was fully absorbed by legacy obligations. Warwick’s Police, Fire, and municipal pension systems required steep increases in annual contributions to maintain actuarial compliance. Retired employee health care (OPEB) costs surged, driven by free lifetime healthcare with zero cost sharing, $800 annual cap on prescription drug costs, increasing number of municipal retirees, high-cost health plans, and national healthcare inflation above CPI. Public safety contracts increased at rates exceeding revenues, locking the city into long-term cost escalation. The city carried substantial debt from earlier capital cycles, leaving little room for new investment. Municipal health-care costs—across active employees—grew dramatically above citywide revenue growth while cost sharing stagnated.
These costs grew automatically, without improving roads, recreation facilities, buildings, public infrastructure, and resident services. The city’s rising budget was consuming every new tax dollar collected because of rising legacy costs.
Thus, when the School Department argues it was “underfunded,” based on increase in the city budget, it fundamentally misinterprets the dynamic.
D. The Lost Decade: When Downsizing Should Have Allowed Investment
Between 2012 and 2020, Warwick experienced the most significant decline in school enrollment in its history. This period should have freed up education dollars through consolidation, allowed reinvestment in infrastructure, created city capacity for capital improvements, built reserves for future obligations, lowered the long-term cost structure of the district, and provided tax relief for Warwick citizens & businesses.
But none of this occurred because the School Committee did not consolidate buildings, staffing was not realigned when appropriate, capital investments were misdirected toward buildings that could have been candidates for closure, COVID ESSER funds distorted the school operating costs, Internal controls in both school and city budgets remained weak and city legacy costs consumed municipal surpluses. The result was a decade in which Warwick effectively stood still while underlying liabilities multiplied.
The shrinking gap between school and city appropriations can be explained in one sentence, schools stagnated due to misalignment; the city increased due to legacy obligations; neither delivered improved outcomes and schools were not underfunded.
This is why, schools felt “cuts” even though enrollment dropped and dollars stayed steady. The city felt “cash-strapped” even though spending increased. Residents saw declining services from both sides and investment in infrastructure did not occur. This dual structural failure explains why Warwick is now in a fiscal crisis.
E. The Reckoning: $350 Million Bond Arrives in a System Already Overextended
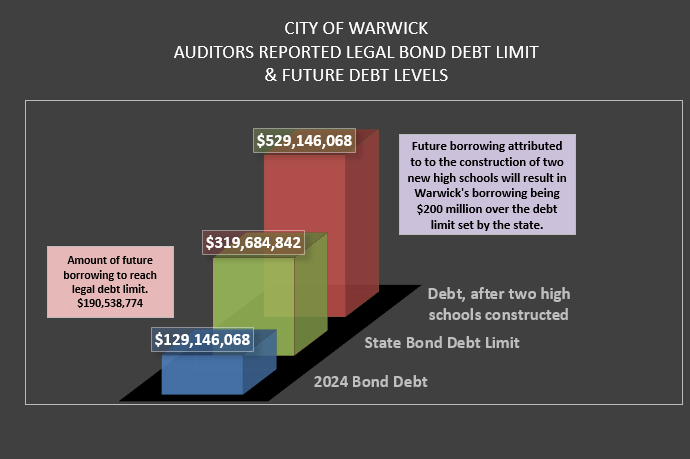
Warwick is now entering the most financially vulnerable era in its modern history. The $350 million high school bonds will require massive annual debt service payments for 20 years. These payments will fall squarely on a city budget that is consumed by legacy obligations. A school budget still structurally misaligned and a community that has aging infrastructure.
Neither the City nor the School Department prepared for this moment. Instead of twenty years of building consolidation, workforce alignment, capital planning, debt reduction and structural reform, Warwick instead experienced twenty years of parallel drift. The schools avoided restructuring. The city avoided pension and OPEB reforms. Infrastructure deteriorated. Tax pressure grew silently, and political decisions consistently prioritized the short term. Now, with the $350 million high school bonds entering repayment, Warwick must confront all deferred decisions at once.
Warwick is now paying today for what it refused to address for twenty years.